The goal is to compare the performance of Flooding Degree algorithm with the Degree and Closeness versions of Topology Aware algorithm, for different diameters of transmission range. Note that, there is a strong correlation between the transmission range and network connectivity, i.e. the number of components in the system.
For evaluation, the following three metrics have been considered: instability, number of messages sent per second, and longest leader path relative to the component diameter.
This is the percentage of the average time that a node elects a different leader from the eventually unique elected leader of its component. The latter is computed by an oracle based on nodes degree for Flooding Degree and Topology Aware Degree, or closeness centrality for Topology Aware Closeness.
First, the CurrentInstability at time t is computed with the following formula:
where N is the number of nodes in the system, and i the node identifier. Then, the Instability is computed over the entire experiment time, which is the average CurrentInstabilityt from 0, to the end of the experiment (1 800 seconds).
It is the average of the total number of messages sent per second. This metric does not consider probe messages, since the same number of probes is sent by all three algorithms every τ milliseconds.
This metric characterizes how fast a leader can reach nodes of its component. First is computed the longest path of all shortest paths from every node of the component to their current leader. Then, since it depends on the number of nodes in the component, the longest path is divided by the diameter of the component, i.e. the greatest distance between any pair of nodes in the component.
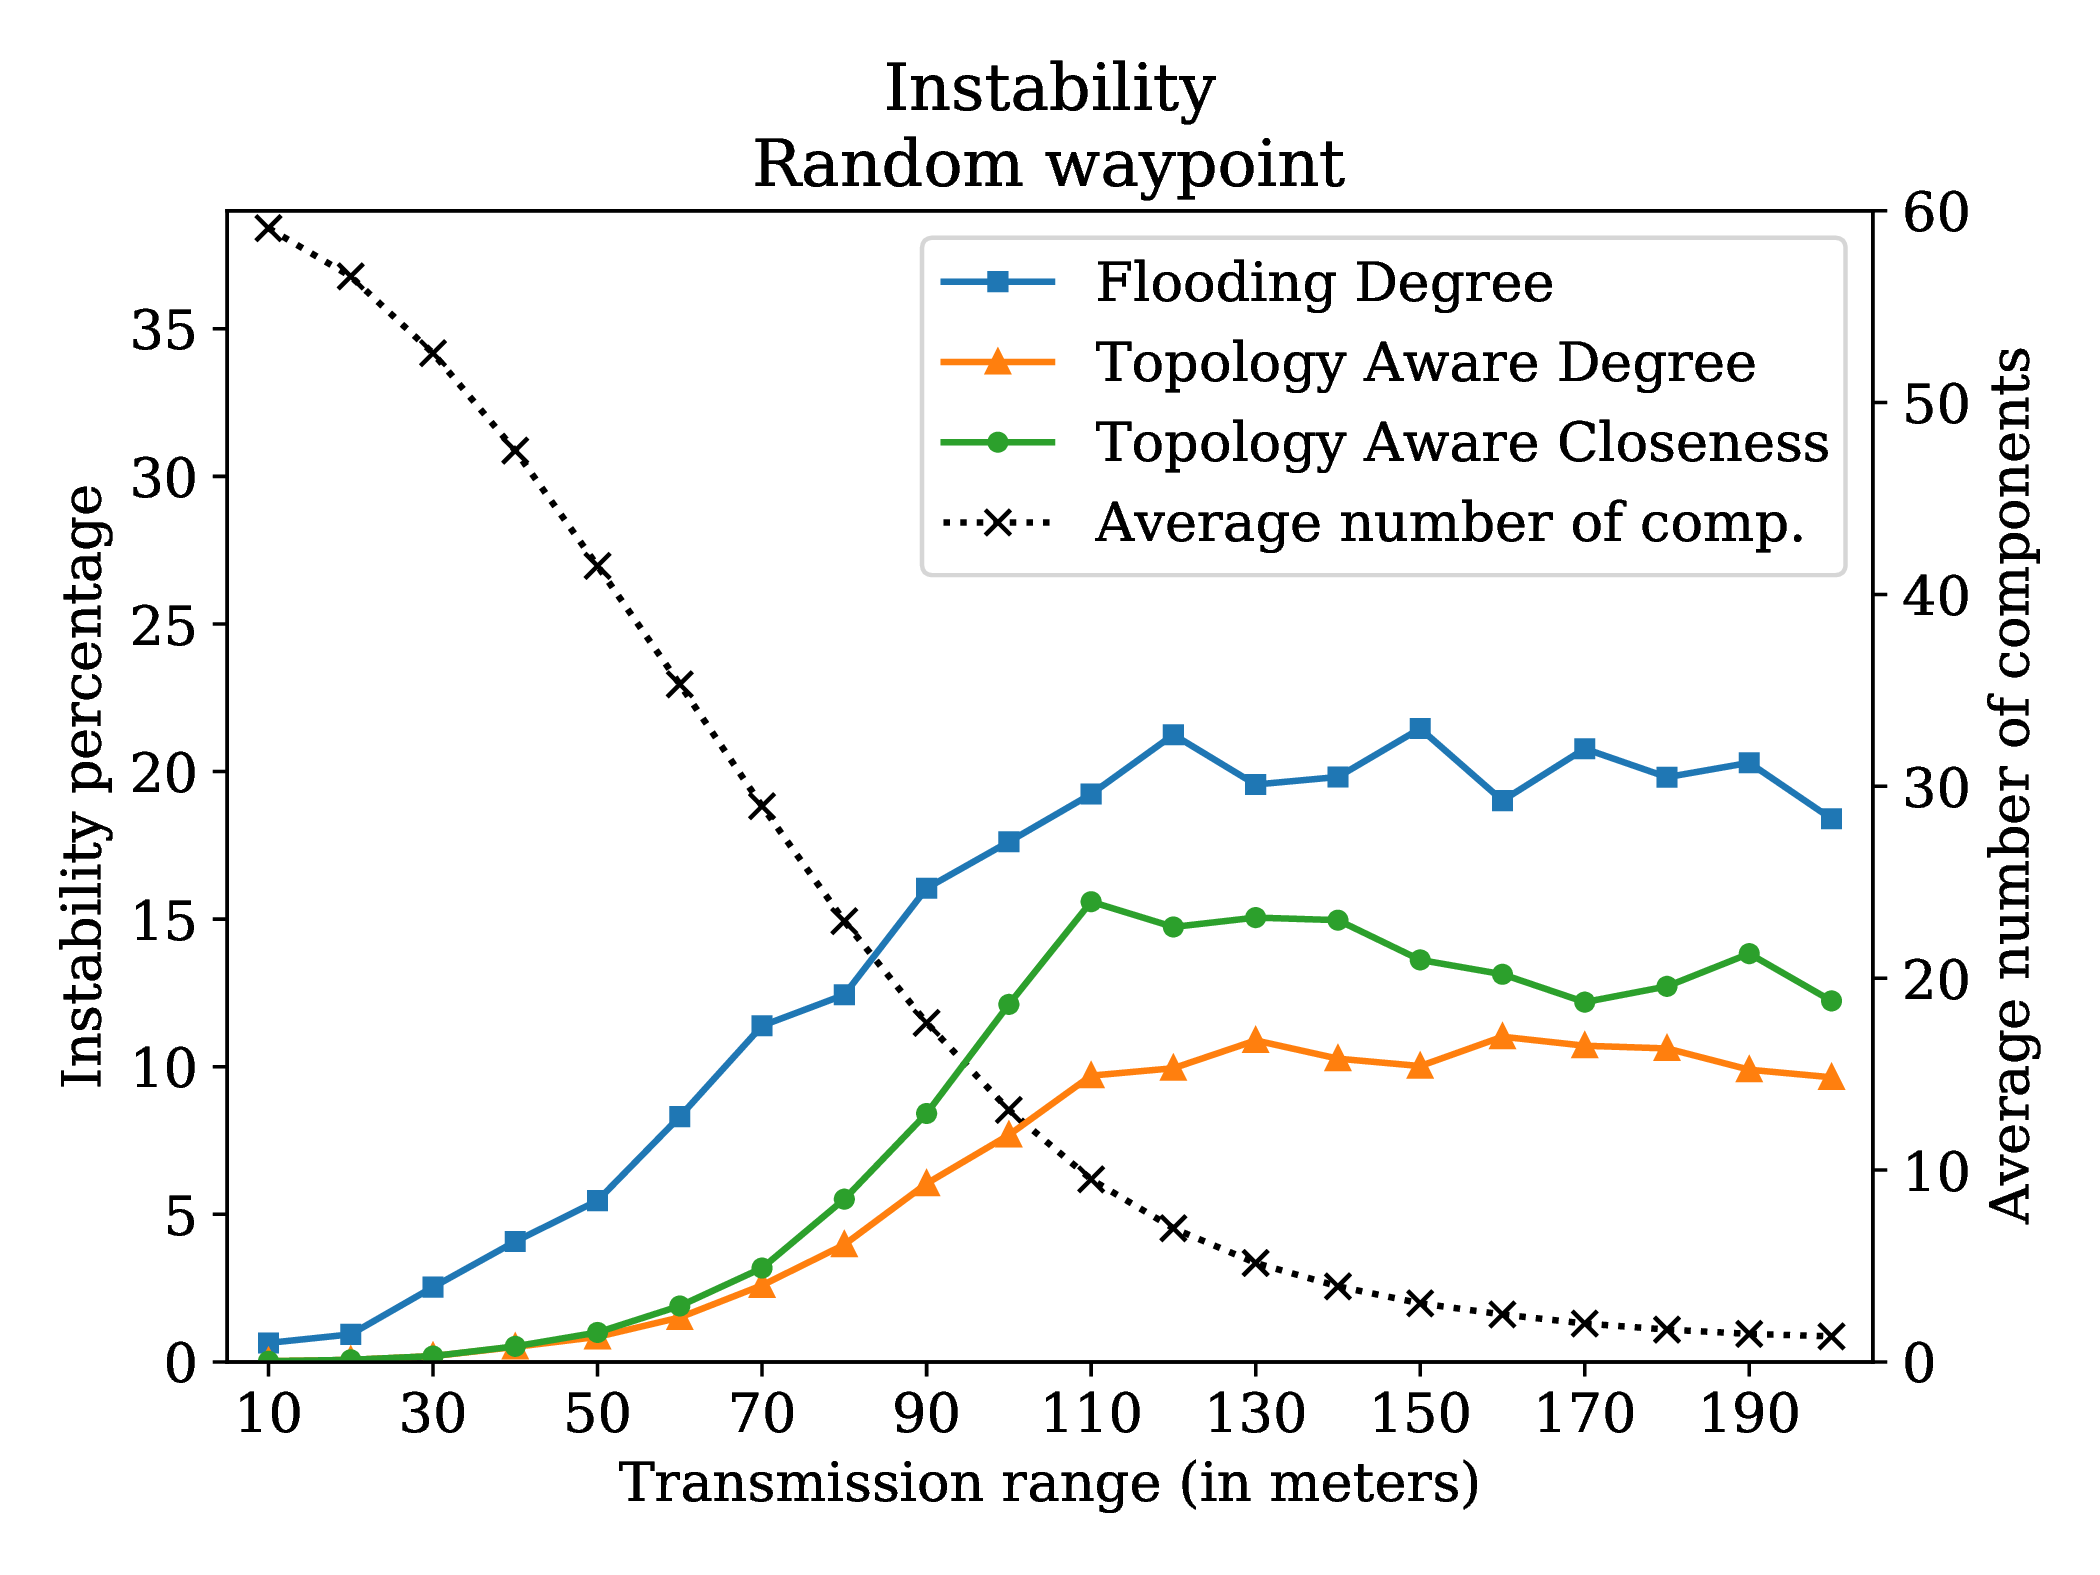
The random waypoint pattern in 4.14 shows that the instability percentage of Flooding Degree and of both Topology Aware versions varies according to the transmission range, with a stabilization starting at a transmission range of 120 meters when the majority of nodes are in a few large connected components. However, nodes in Flooding Degree spend on average 55% more time with the wrong leader than nodes in Topology Aware Degree. Note that the Closeness version of Topology Aware is slightly less stable than the Degree version.
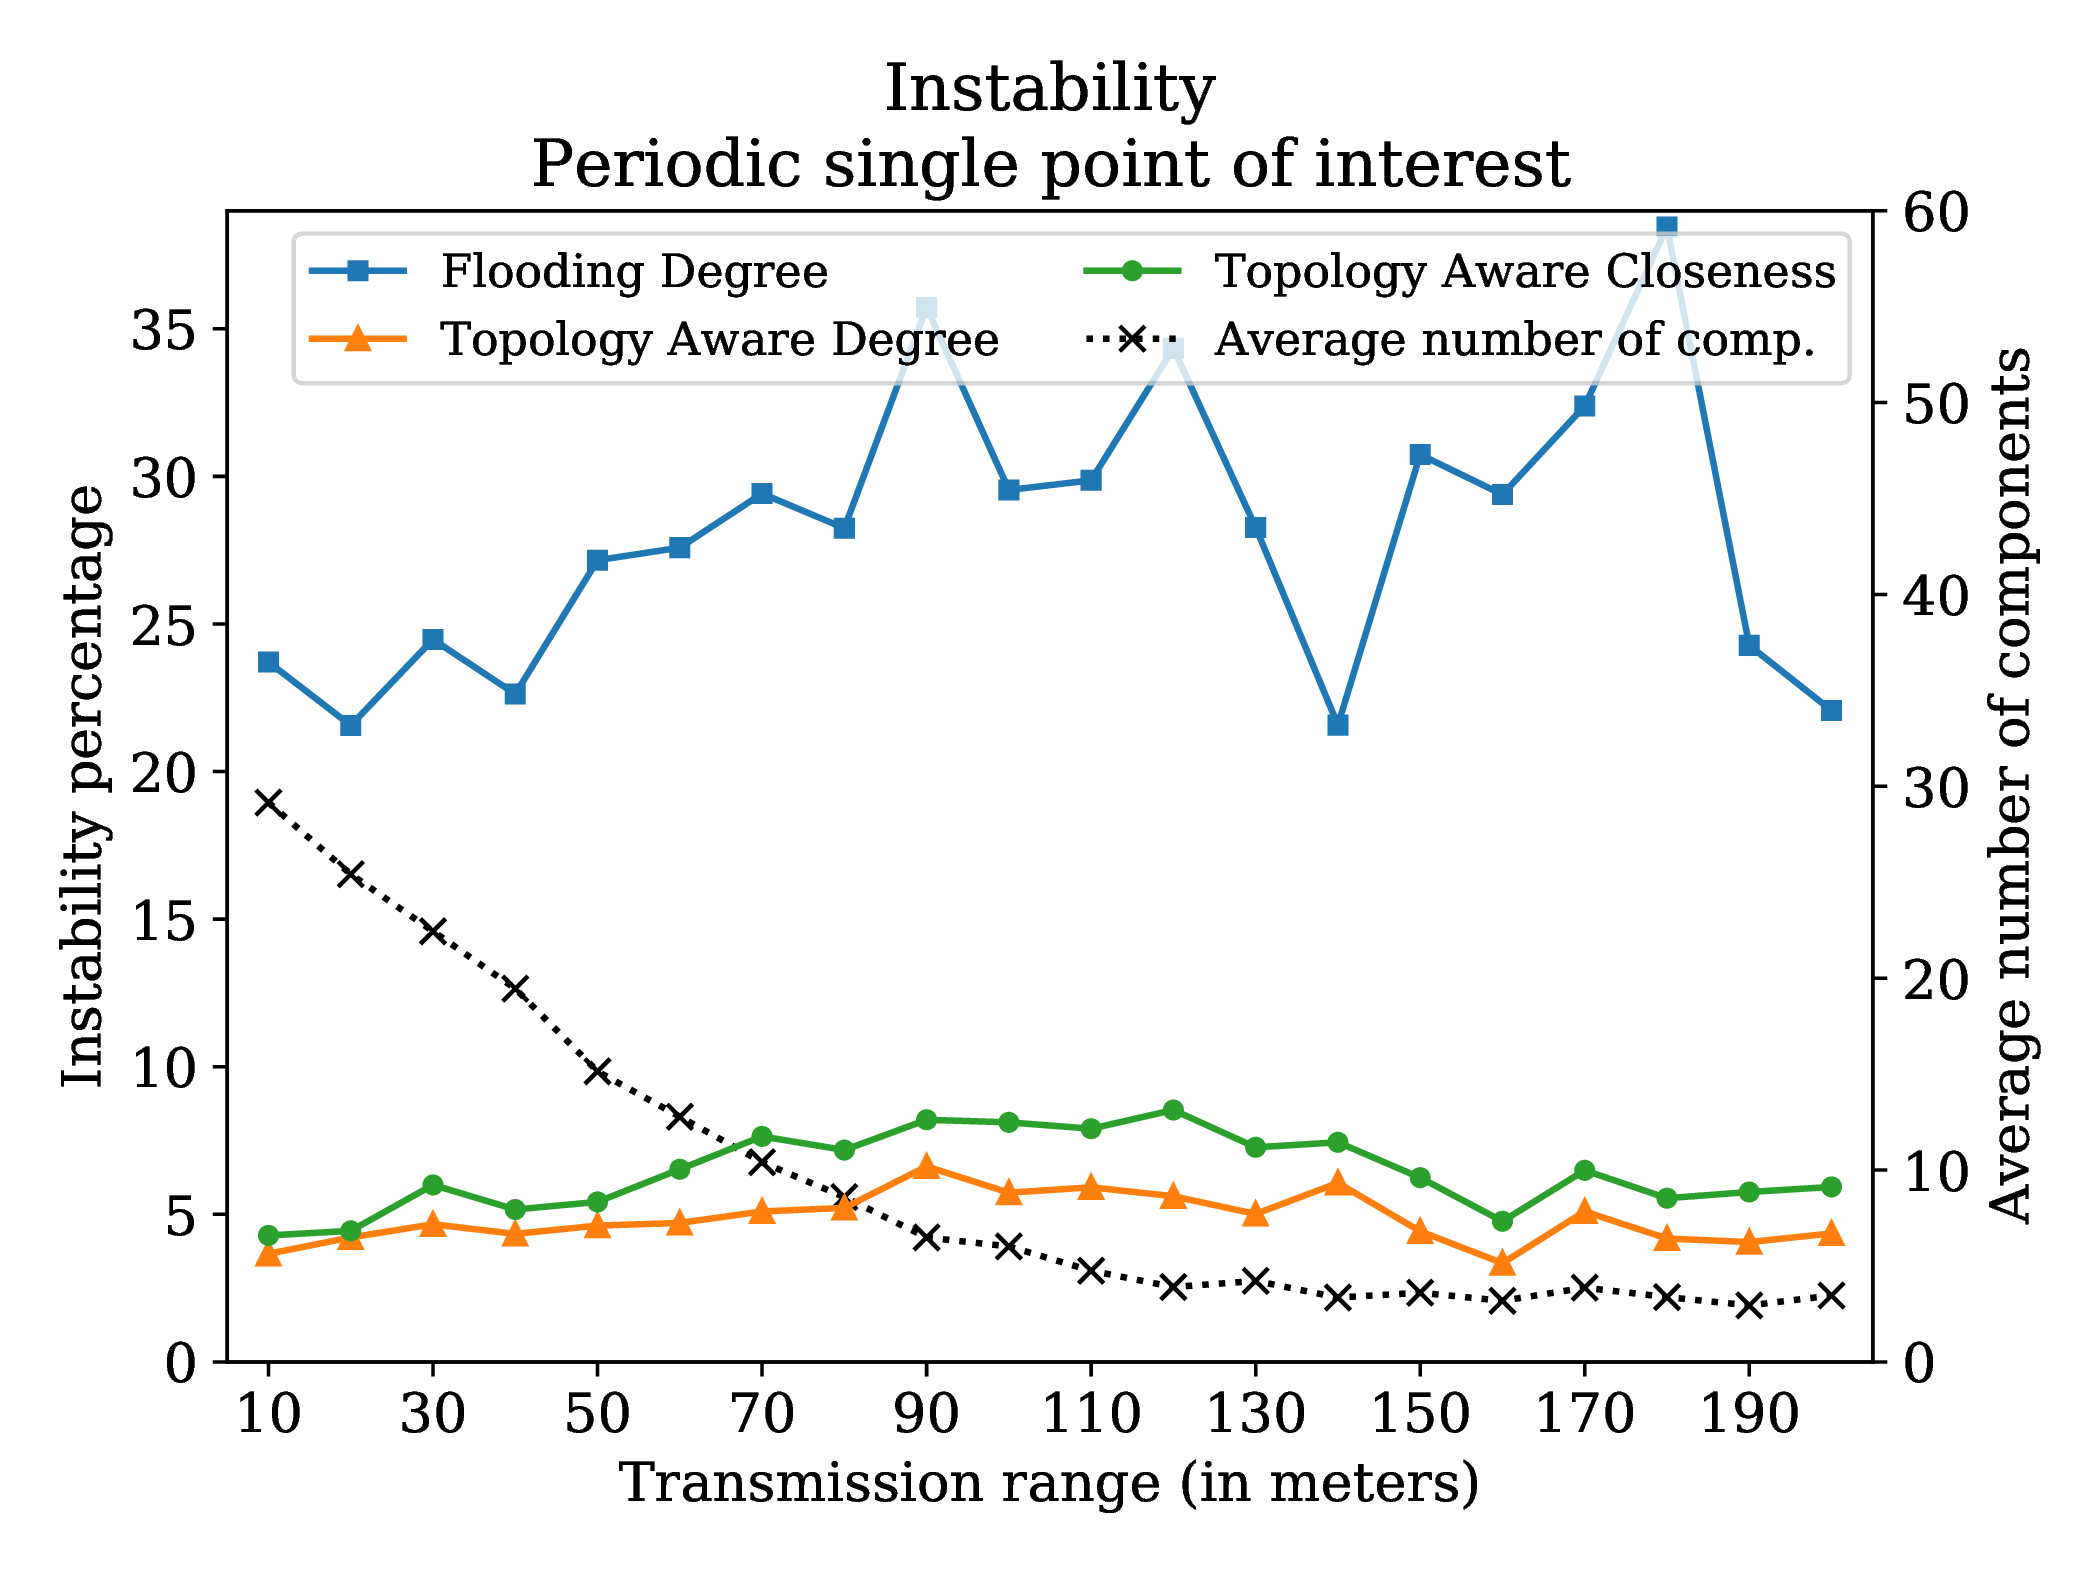
For the periodic single point of interest pattern in 4.15, compared to Topology Aware Degree, Flooding Degree spends on average 82% more time with a wrong leader, i.e. 1.5 times more than the previous mobility pattern. In Flooding Degree, leader unavailability is progressively detected by all nodes of the component, upon expiration of leader messages timeout. In this case, each node of the component triggers a new election by setting itself as the leader, and starts broadcasting leader messages. However, some nodes located further away from the old leader might still receive, from their neighbors, leader messages related to this old leader and, thus, will take more time to start a new election. Furthermore, the greater the number of nodes in the component, the higher the spreading of leader message (as observed in 4.15).
In Flooding Degree, the spreading of leader messages from all the nodes that have started a new election slows down the election convergence and thus increases the average stability. On the other hand, both Topology Aware versions only need to spread updates to each node.
The two versions of Topology Aware are more stable than Flooding Degree, especially in large components where there is low nodes movement, because they need fewer steps to elect a new leader once their topological knowledge is built.
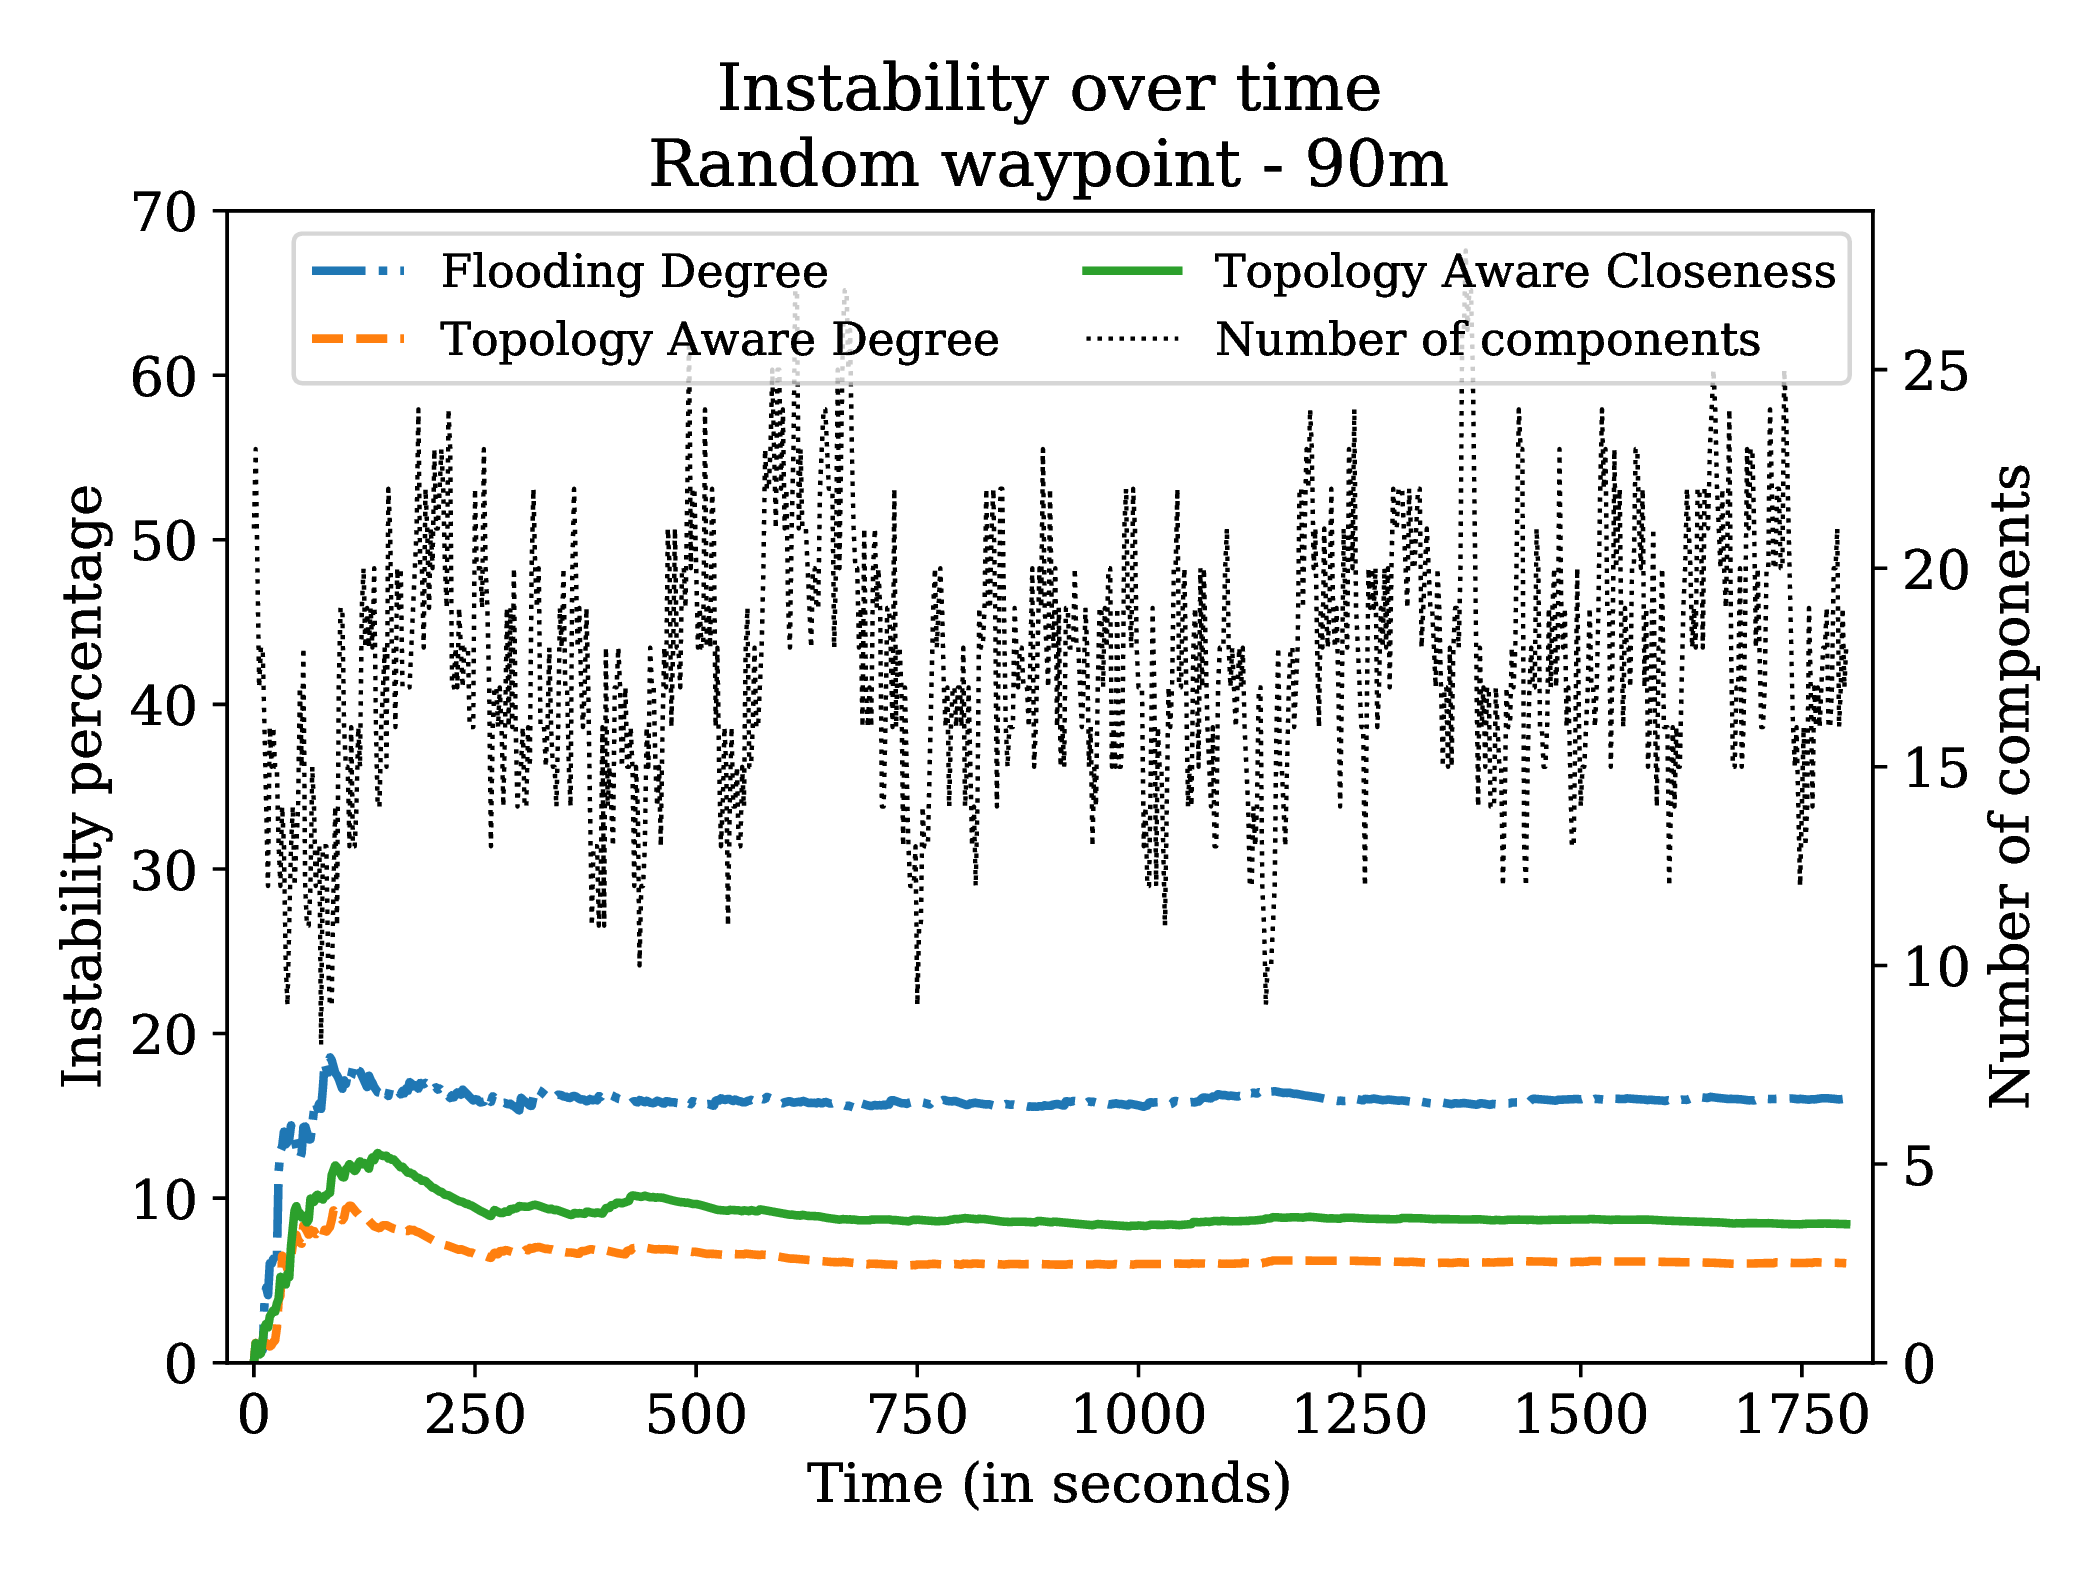
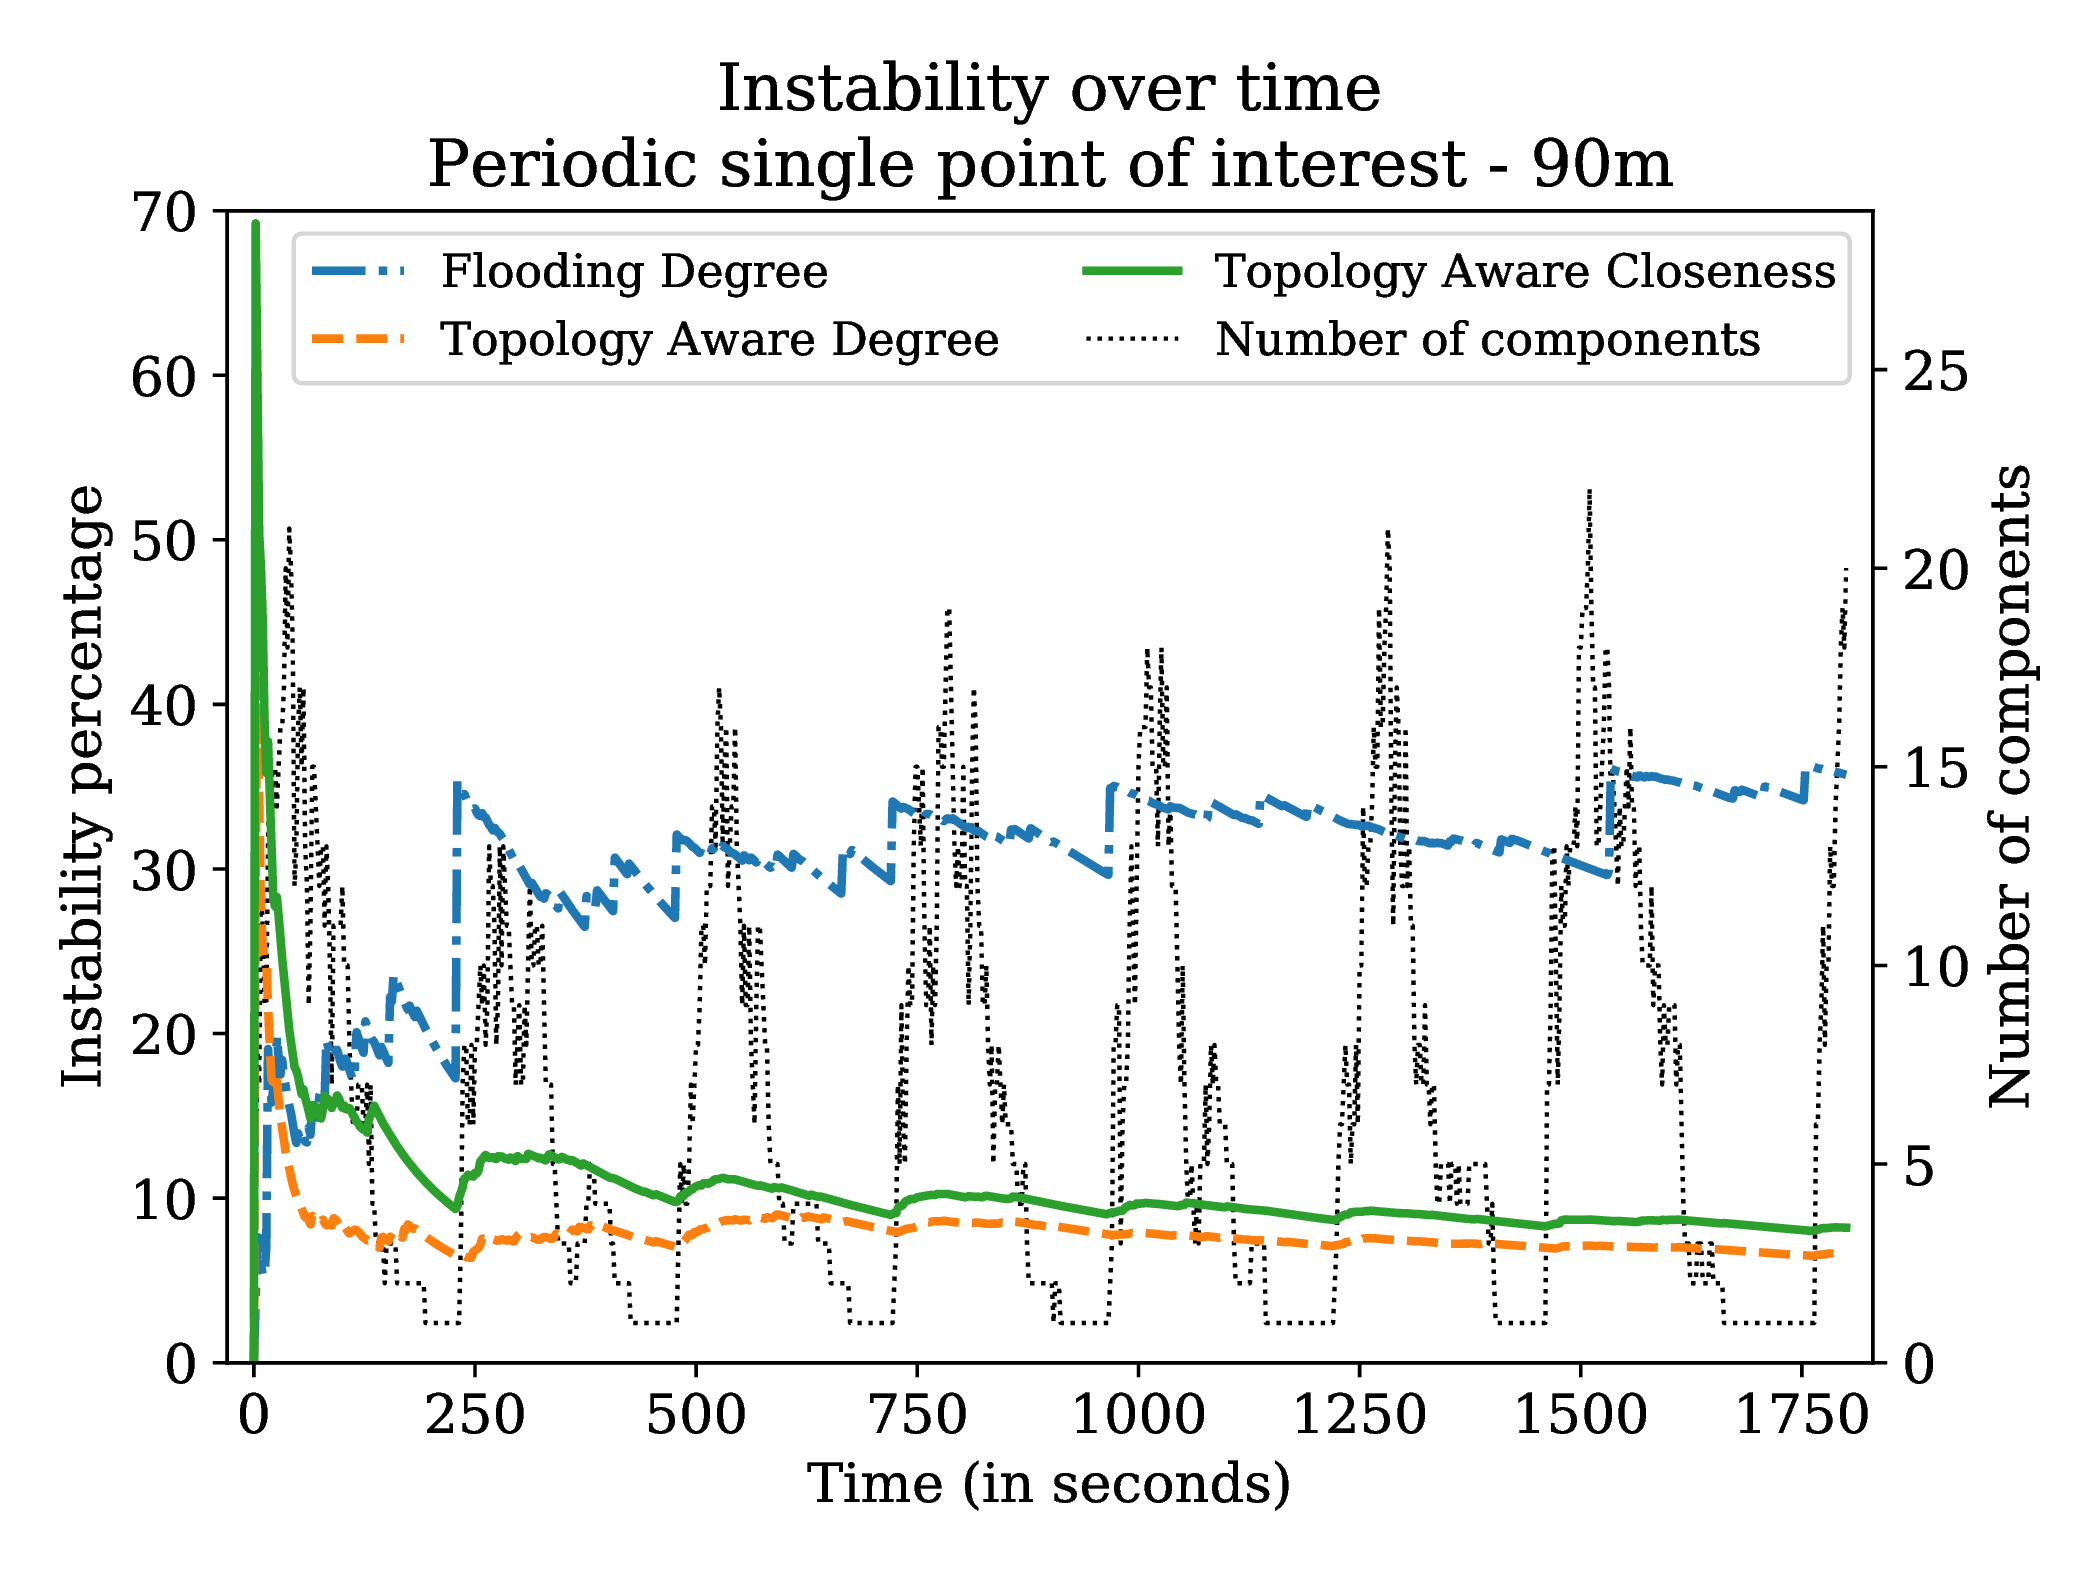
4.16 and 4.17 both show the evolution of instability over time, considering a transmission range of 90 meters which is quite realistic. The instability at time t is the average cumulative instability from time 0 to time t, and the right y-axis is the exact number of components at time t.
As shown in 4.16, the random waypoint mobility pattern has on average 18 connected components, and Topology Aware Degree is on average 62% more stable than Flooding Degree.
For the periodic single point of interest pattern in 4.17, nodes are gathering at their initial position on the disc presented in 4.13, creating a unique connected component, then moving to random positions, also having on average a maximum of 18 components. At the beginning of the experiment, nodes in both Topology Aware versions exchange messages to build their knowledge, inducing many leader errors, hence, an instability rate of 41% for the Degree version and 69% for the Closeness one. However, Flooding Degree quickly finds the correct leader, thus, showing low instability. After the second gathering and until the end of the experiment, the two Topology Aware versions are on average 79% more efficient to elect the correct leader than Flooding Degree, which increases its instability after each gathering, when nodes start to randomly move again.
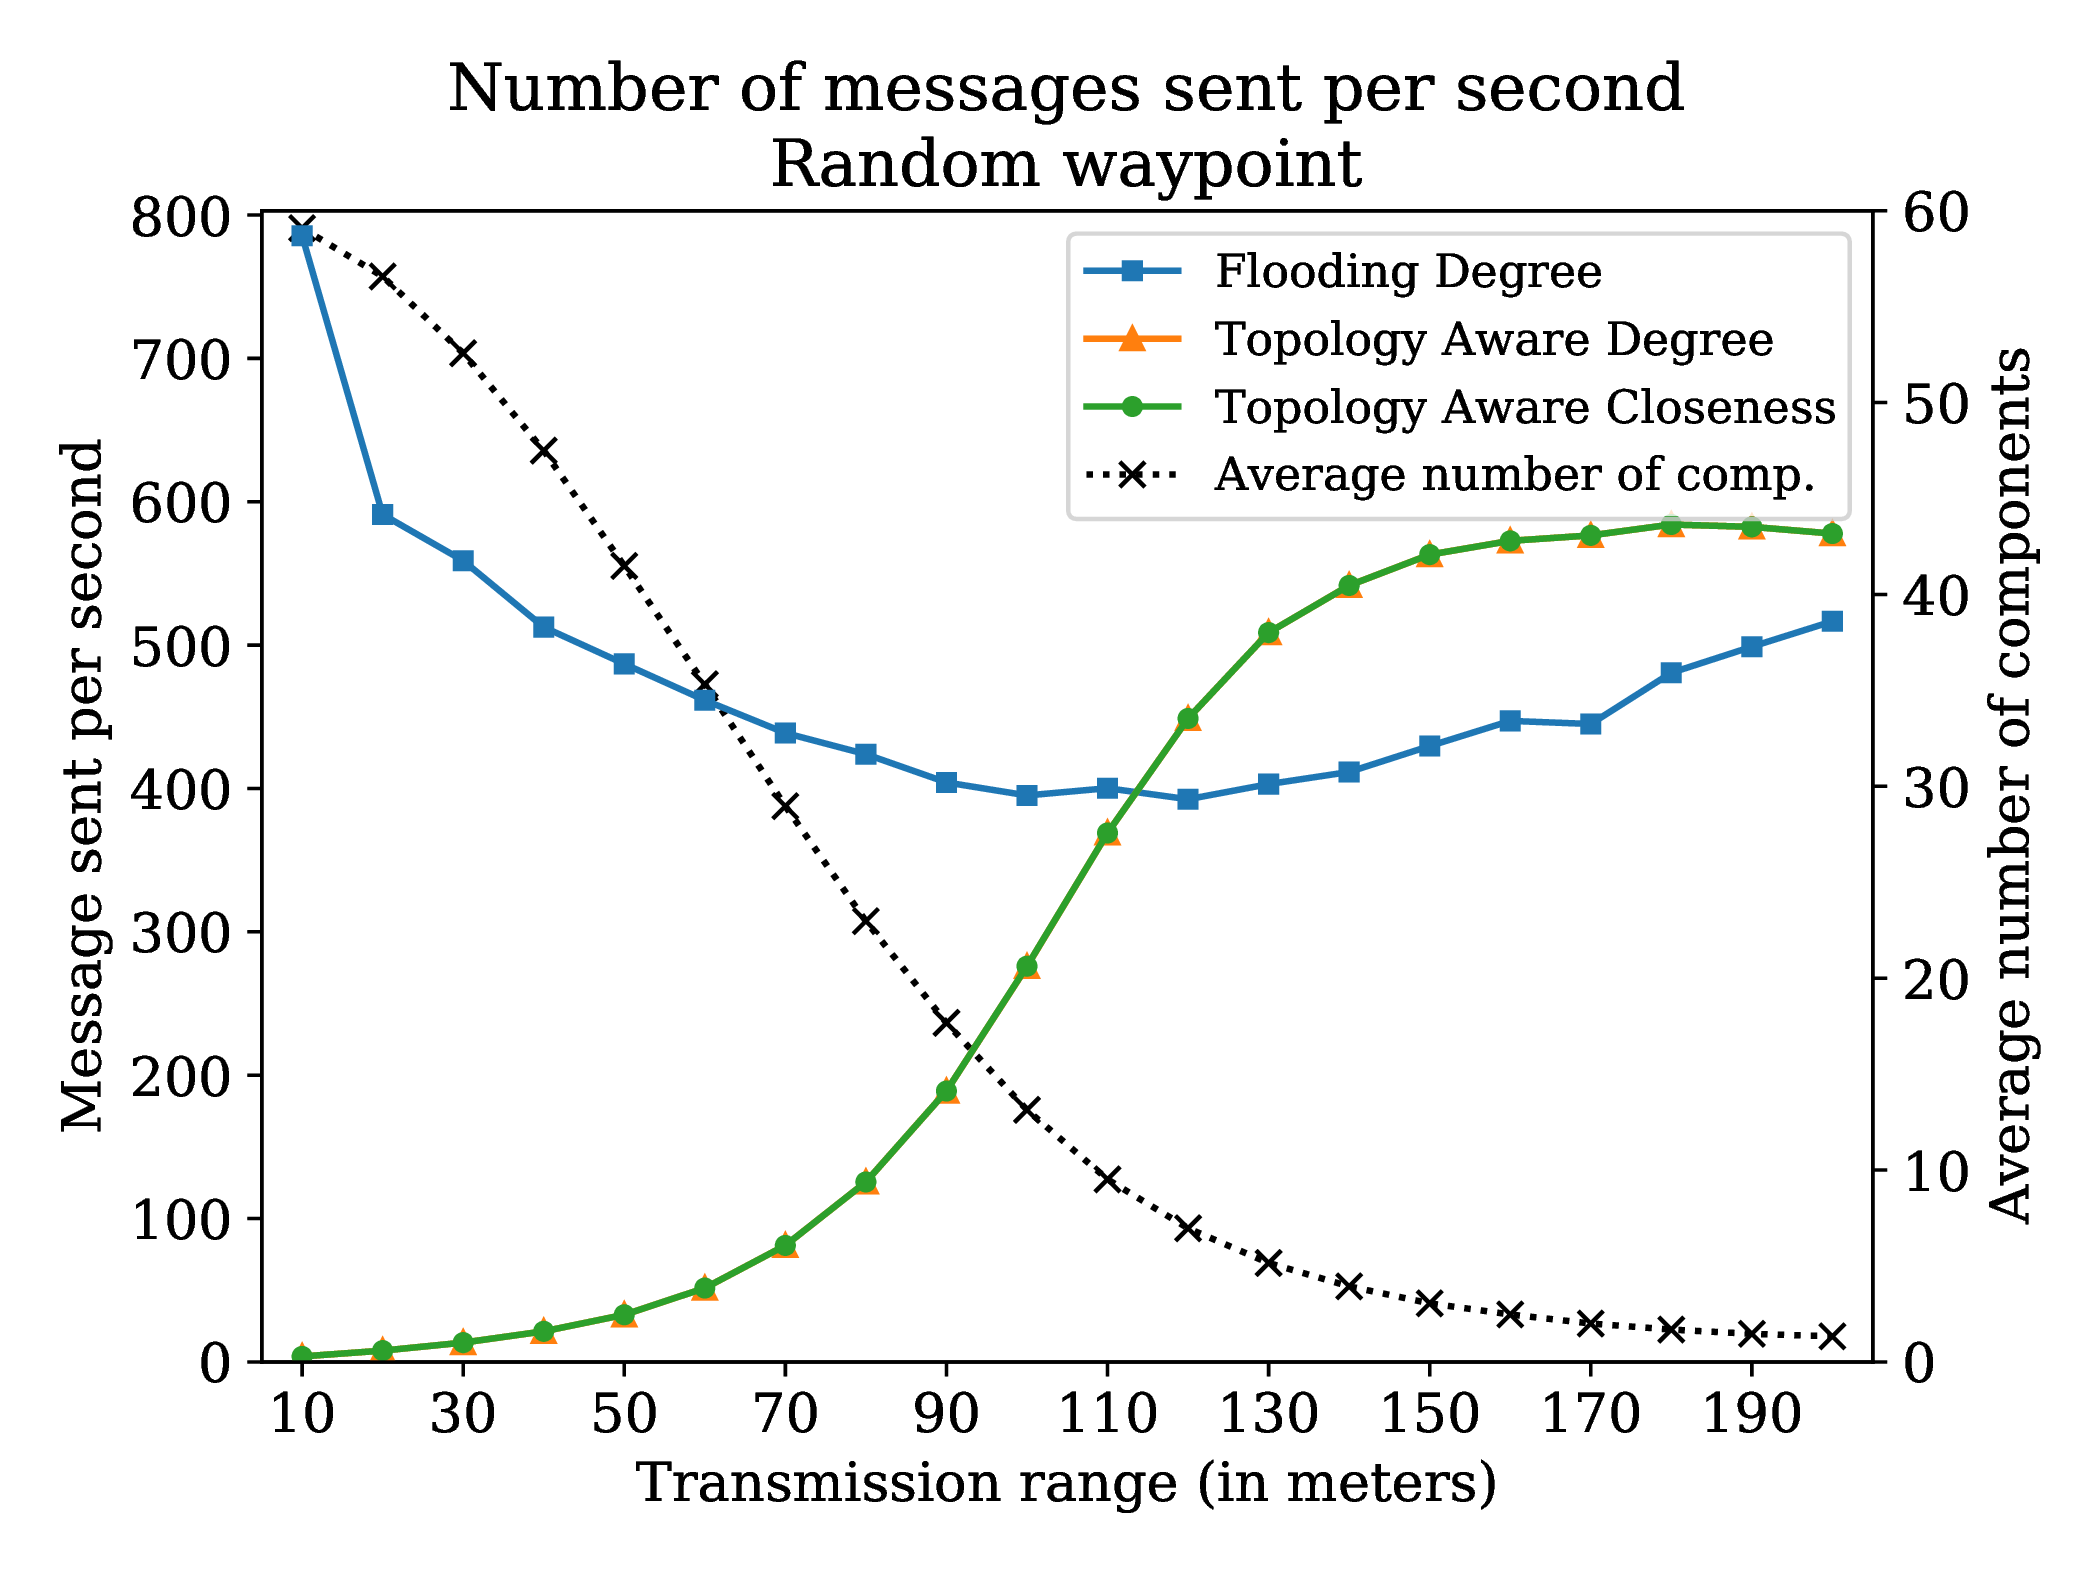
The previous section shows that the smaller the transmission range, the higher the number of components. Therefore, in the case of low transmission ranges, there are more components, and consequently, more leaders. This higher number of leaders explains why Flooding Degree presents bad performance with low transmission ranges, since each leader floods its component with leader messages. When the transmission range increases, the number of leaders decreases, thus reducing the number of flooding messages. On the other hand, Topology Aware algorithms behave inversely: when the transmission range increases, each node observes more topological movements, therefore, increasing the amount of new knowledge and update messages. These behaviors are well characterized in 4.18, especially for the random waypoint pattern. Note that the number of messages sent in both Topology Aware versions is the same because the election criterion does not impact the number of messages.
An interesting threshold effect is observed from the transmission range of 130 meters. At this range, components are bigger and start to become more stable in terms of topology changes. Topology Aware algorithms benefit from the topology stability since:
On the opposite, Flooding Degree is punished by the size of the components, because it is not sensitive to topology changes and flooding is more costly when the number of links increases. This explains why the curves of Topology Aware versions stabilize while the curve of Flooding Degree increases.
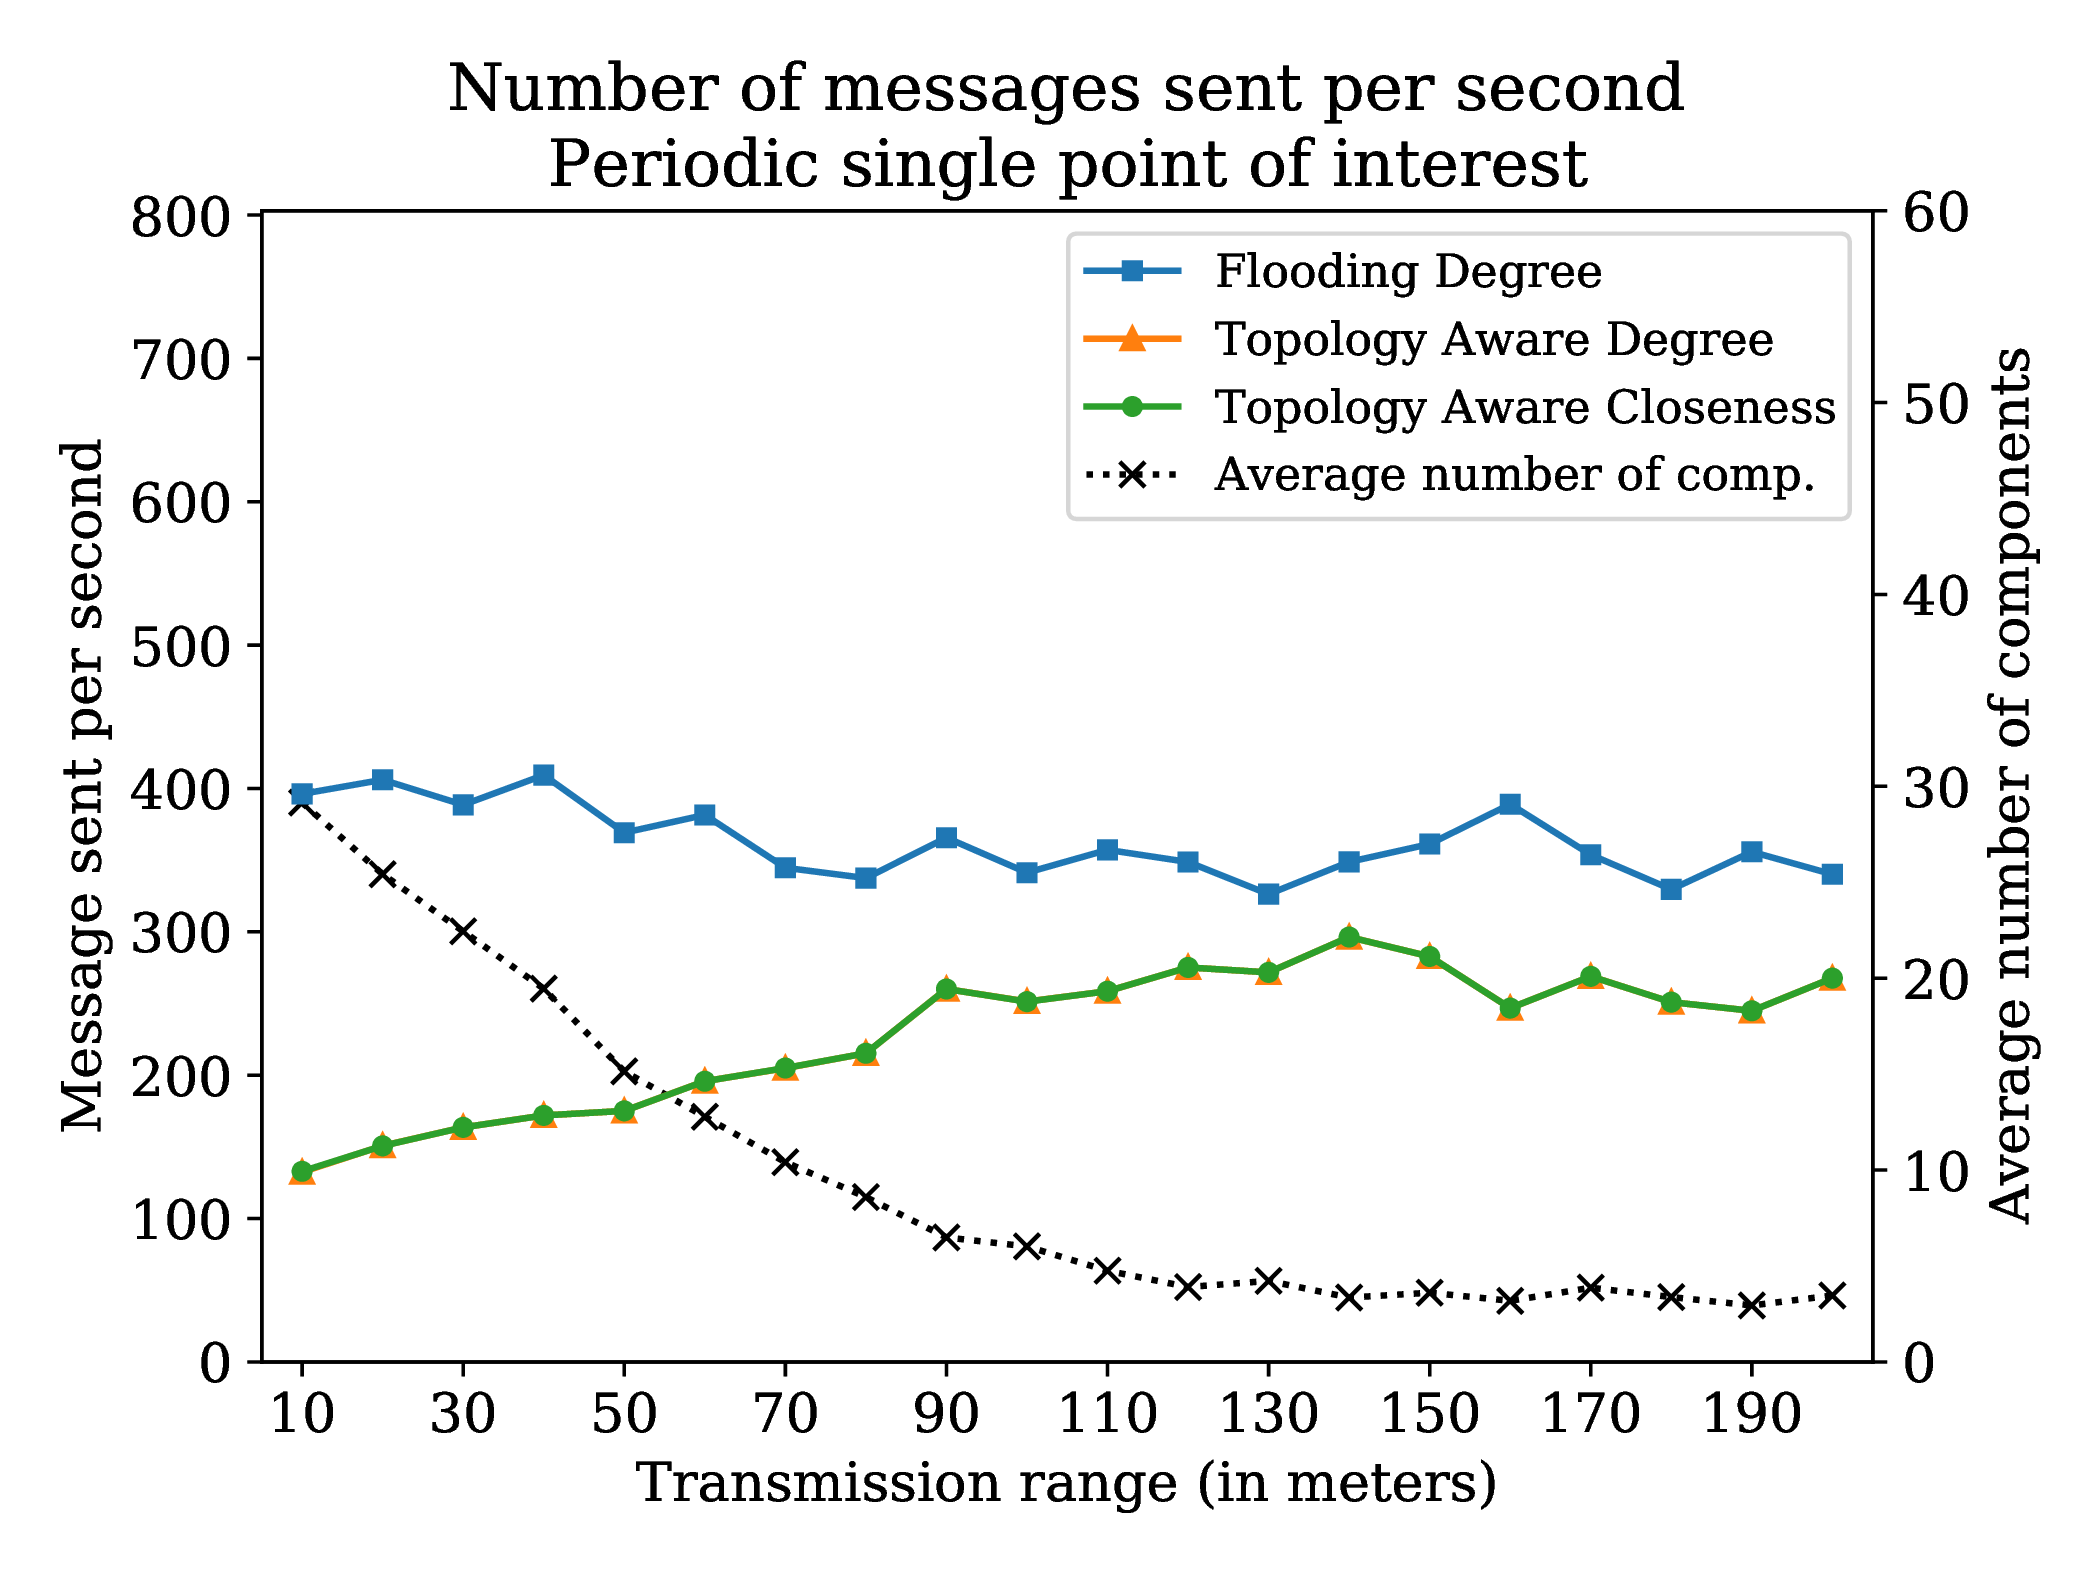
For the periodic single point of interest pattern in 4.19, both versions of Topology Aware send fewer messages, because they do not need to communicate when the topology is motionless. As the number of nodes in the component increases, the number of messages also increases, depending on the value of Δ that impacts the number of messages sent per second. On the other hand, Flooding Degree sends more messages than the two Topology Aware versions, because even if the topology is static for a while, a flooding algorithm continues to periodically send information about its current leader.
However, the size of messages exchanged in both Topology Aware algorithms is larger than in the Flooding Degree algorithm. In 4.1, the Flooding Degree algorithm presents the same average message size since messages contain just a node identifier and a value, i.e. two integers. On the other hand, the size of messages in Topology Aware varies according to the number of nodes in the connected component. Therefore, messages in both Topology Aware versions have larger sizes when compared to the Flooding Degree algorithm. Note that the values of message sizes in Table 4.1 contain additional information needed by the simulator, which is identical to the three algorithms. Furthermore, since the size of messages remains below the MTU value of wireless networks, a message fits within a single packet.
|
|
|
|||||||
| 196 | 705 to 1284 | 681 to 1260 | ||||||
| 196 | 786 to 942 | 760 to 915 | ||||||
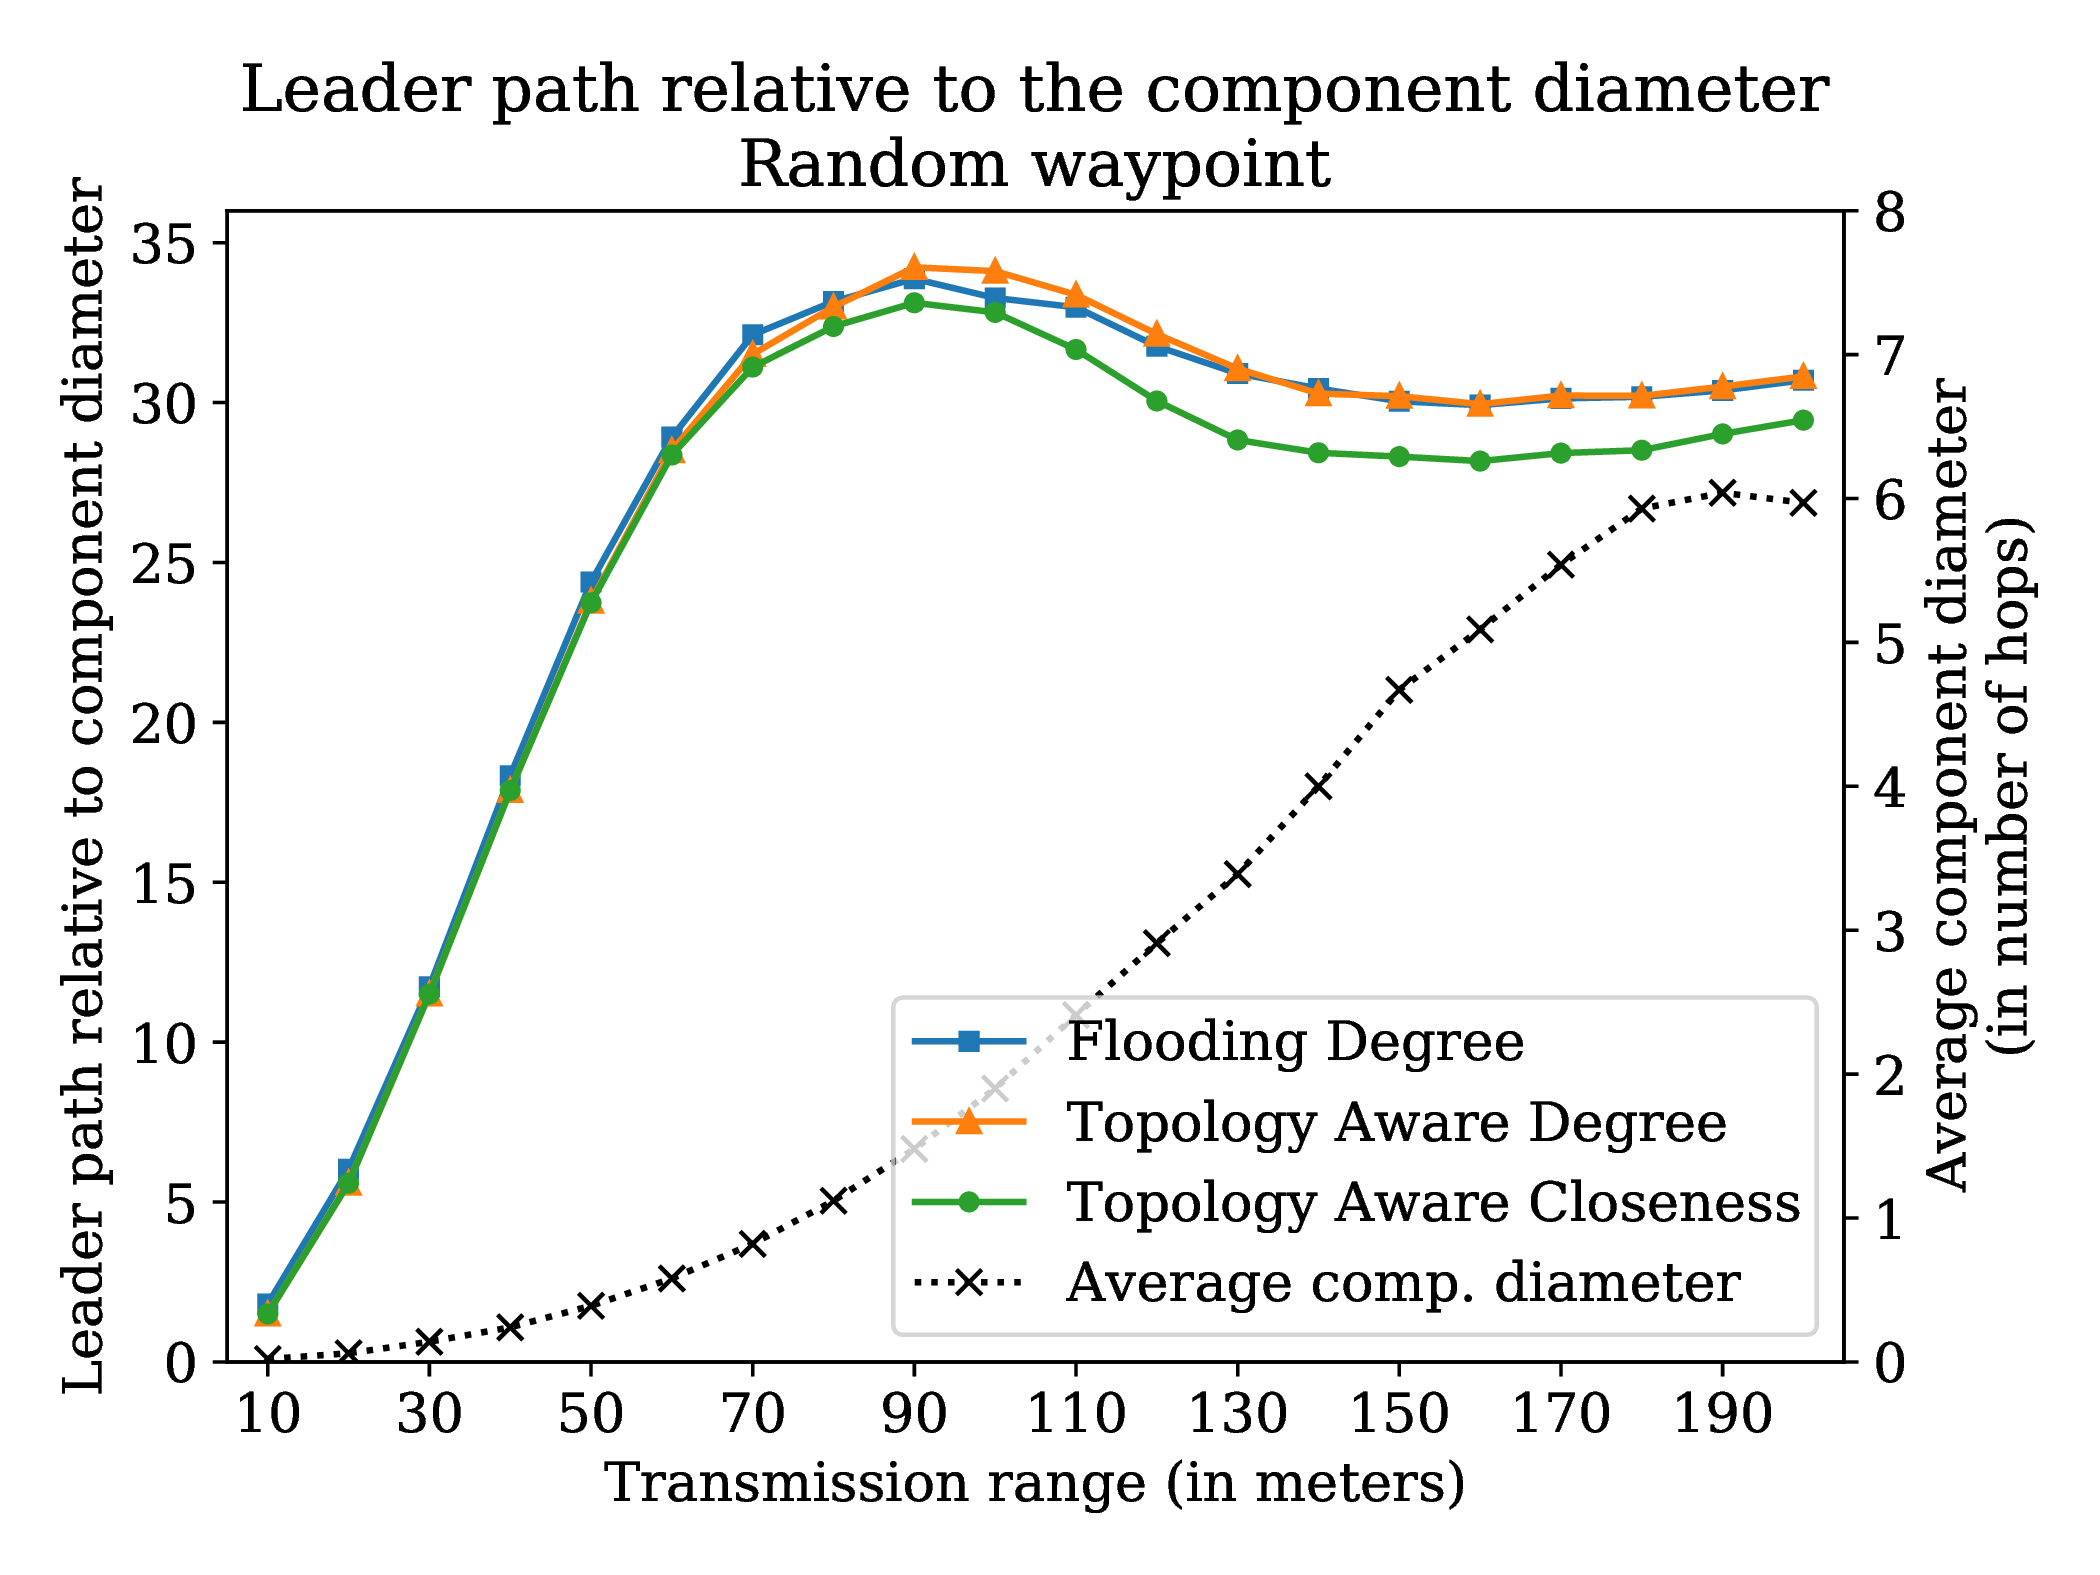
4.20 gives the average longest path to the leader (y-axis left) and the average component diameter (y-axis right) for both mobility patterns. It shows that an election criterion based on Closeness centrality shortens paths to the leader compared to an election criterion only based on Degree.
For the random waypoint pattern, low transmission ranges lead to small components with only some nodes. Therefore, paths to the leader are most of the time direct links or contain only a few nodes. When the transmission range increases, Topology Aware Closeness is better than Flooding Degree, thanks to its component central leader choice.
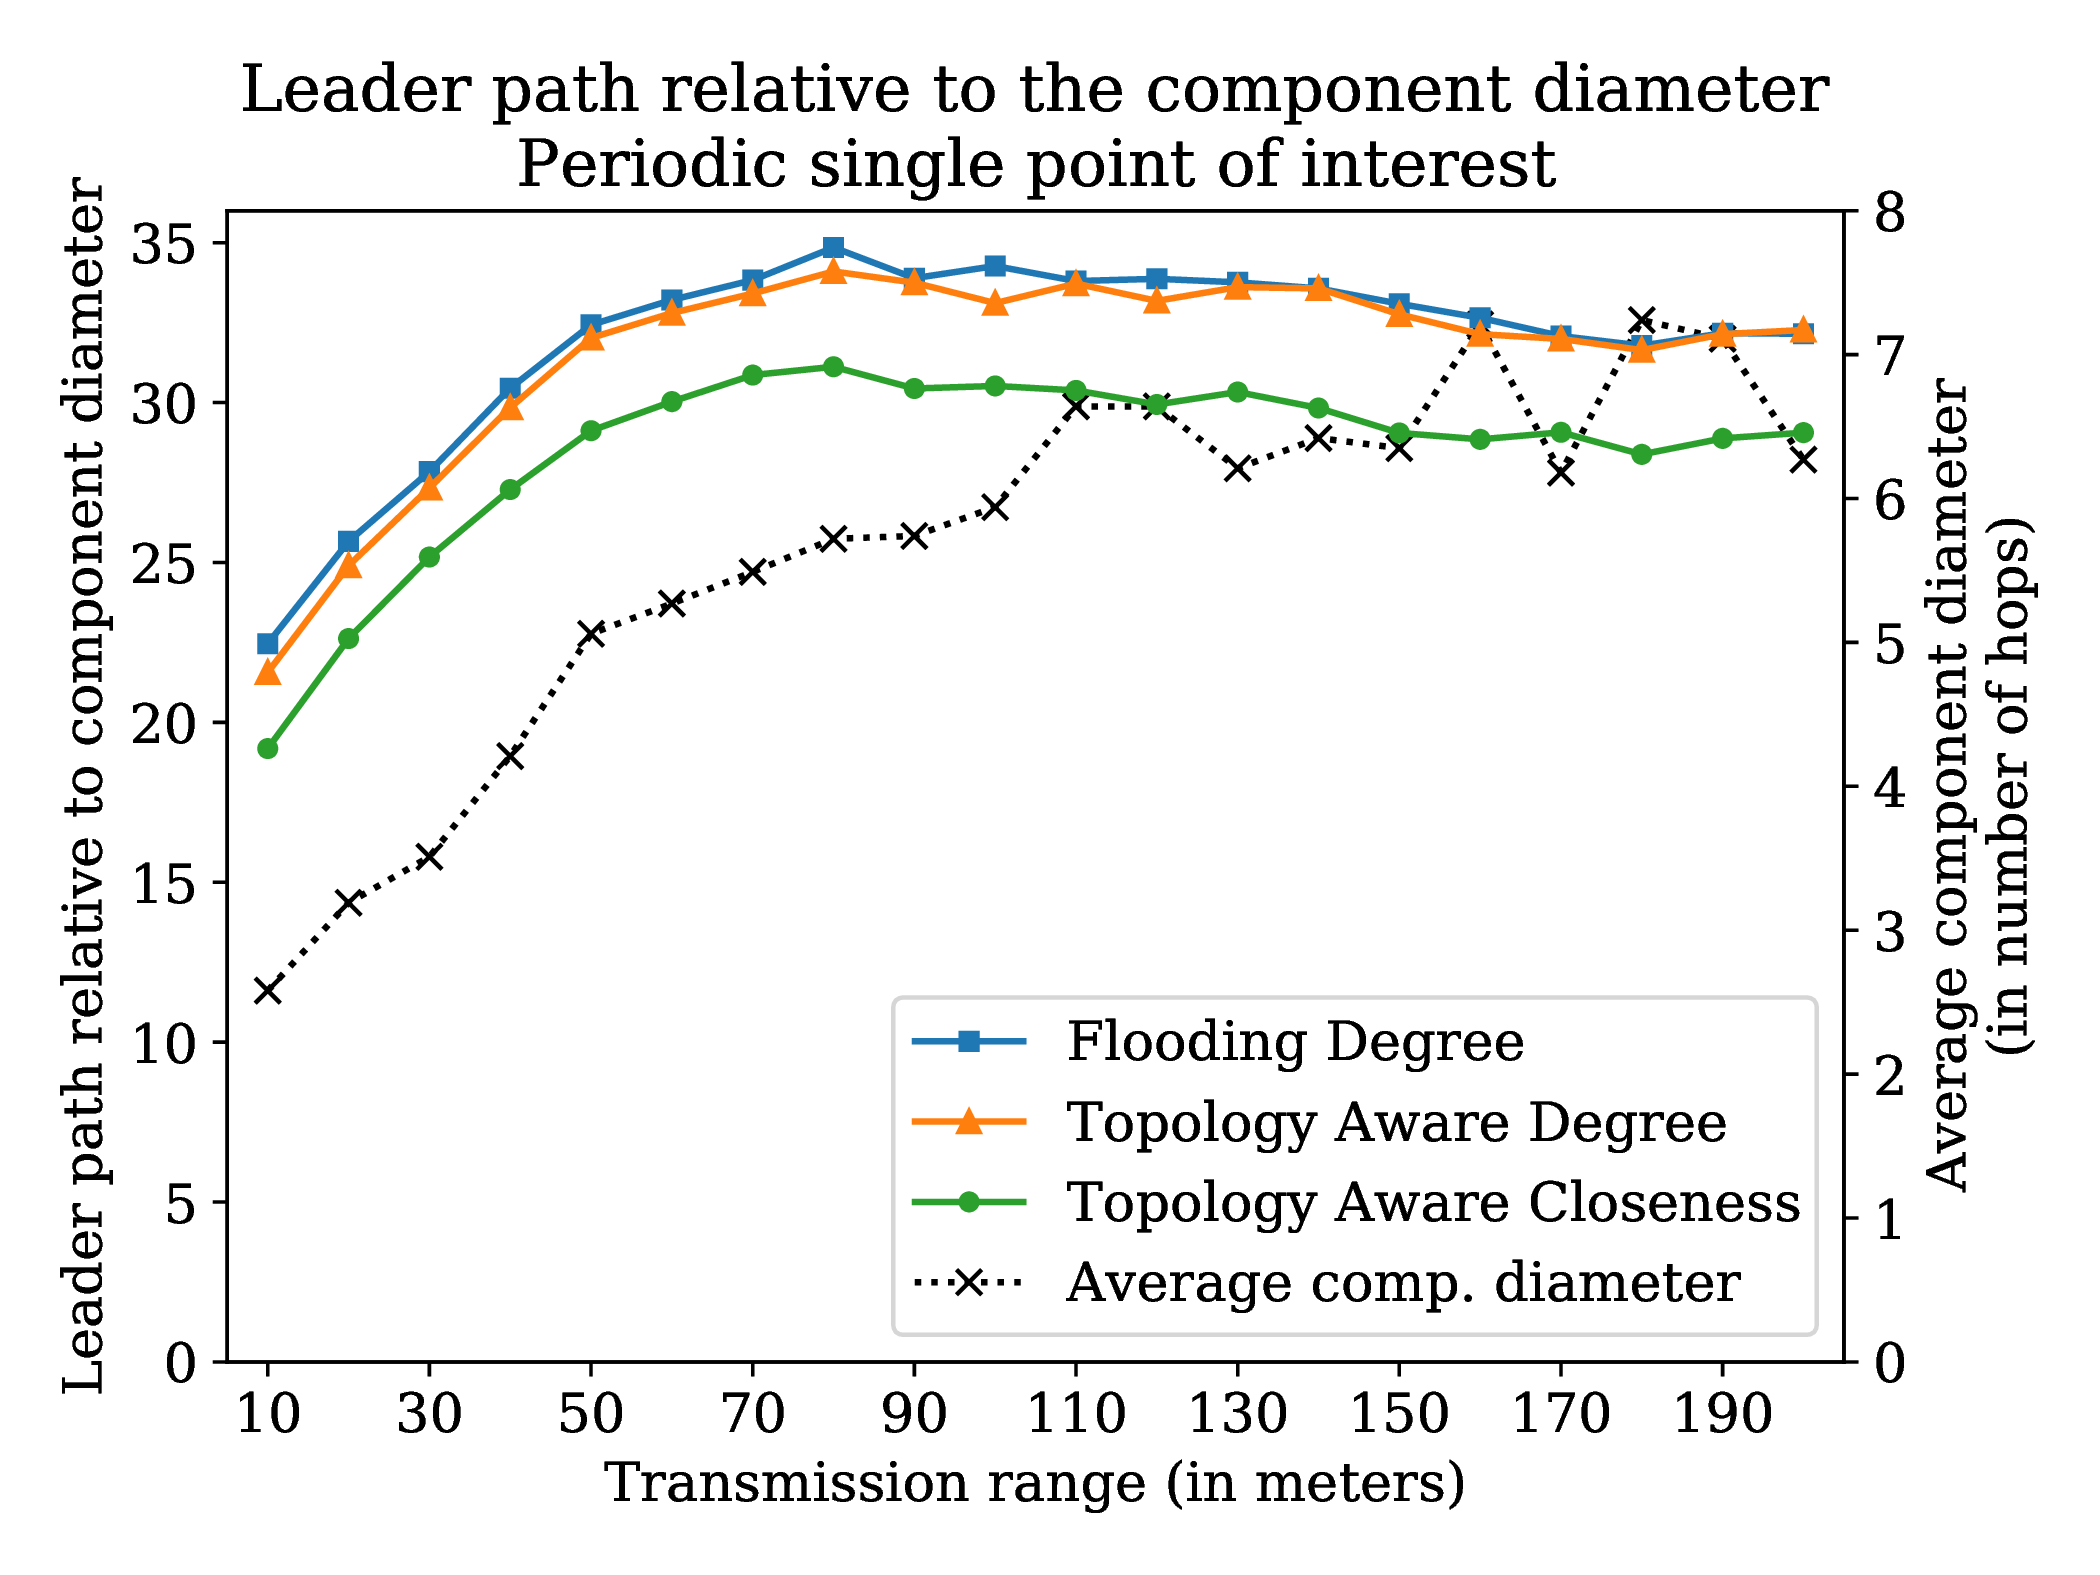
For the periodic single point of interest pattern in 4.21 however, since the shape of the disc is independent of the transmission range, there is periodically only one component comprising the entire network. It can be observed that Topology Aware Closeness is 11% better than Flooding Degree. Topology Aware Degree has a similar behavior to Flooding Degree as both have the same election criterion.
Some experiments were conducted aiming at injecting fault on the leader node in a static configuration, evaluating then the average time to elect a new leader when the transmission range varies from 10m to 200m. After nodes have exchanged information to elect the eventual leader of the component, the leader crashes and recovers periodically. Results in 4.2 show the average election time to elect the new leader. It can be observed that for both Topology Aware versions the election time is larger than Flooding Degree, because the buffering of update messages slows down message transmission time of each node as the transmission range increases. However, this time remains low (smaller than 1 second).
|
|
|
|||||||
| 422 (σ = 38) | 820 (σ = 188) | 731 (σ = 154) | ||||||