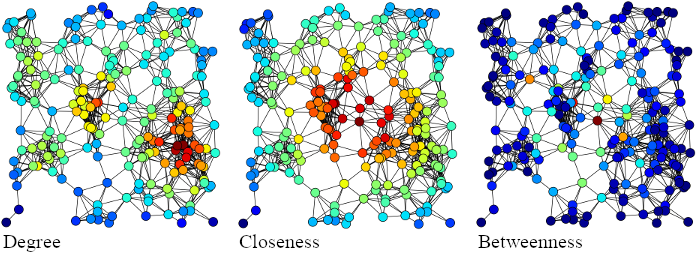
2.7 Centralities

In a graph, some vertex can have a higher importance than others. Importance can have a wide range of meaning, from the type of flow through the network [Bor05], to the involvement of the cohesion in the network [BE06], or even the topological position in the network [Bav50]. Indicators of centrality can be used to assign a number or a ranking to vertices, according to their position in the network, identifying the importance of the vertices in a graph [Fre78; Bor05; Gha18].

In terms of centrality, this thesis focuses on the three following centralities based on the shortest path:

A visual representation given in 2.8 compares the degree centrality with the closeness centrality and the betweenness centrality of the same graph [Tap15].

PIC

Figure 2.8: Comparison between degree centrality, closeness centrality and betweenness centrality of the same graph, by Tapiocozzo [Tap15]

The more red a vertex is, the higher its centrality. The more blue a vertex is, the lower its centrality. In 2.8, the most central vertex for the degree centrality is different than for the closeness and betweenness centrality. However, closeness and betweenness centrality are not always equal.

The differences between closeness and betweenness centrality are the following: closeness is generally regarded as a measure of access efficiency, i.e. how long it will take to spread information from x to all other vertices sequentially; whereas betweenness is usually interpreted as a measure of the dependence of others on a given vertex, i.e. the number of times a vertex is present on the shortest path between two other vertices [BBF16; Du19].


Table of Contents

1 Introduction
1.1 Contributions
1.1.1 Topology Aware Leader Election Algorithm for Dynamic Networks
1.1.2 Centrality-Based Eventual Leader Election in Dynamic Networks
1.2 Manuscript Organization
1.3 Publications
1.3.1 Articles in International Conferences
1.3.2 Articles in National Conferences
2 Background
2.1 Properties of Distributed Algorithms
2.2 Timing Models
2.3 Process Failures
2.4 Communication Channels
2.5 Failures of Communication Channels
2.6 Distributed Systems
2.6.1 Static Systems
2.6.2 Dynamic Systems
2.7 Centralities
2.8 Messages Dissemination
2.9 Leader Election
2.9.1 Classical Leader Election
2.9.2 Eventual Leader Election
2.10 Conclusion
3 Related Work
3.1 Classical Leader Election Algorithms
3.1.1 Static Systems
3.1.2 Dynamic Systems
3.2 Eventual Leader Election Algorithms
3.2.1 Static Systems
3.2.2 Dynamic Systems
3.3 Conclusion
4 Topology Aware Leader Election Algorithm for Dynamic Networks
4.1 System Model and Assumptions
4.1.1 Node states and failures
4.1.2 Communication graph
4.1.3 Channels
4.1.4 Membership and nodes identity
4.2 Topology Aware Leader Election Algorithm
4.2.1 Pseudo-code
4.2.2 Data structures, variables, and messages (lines 1 to 6)
4.2.3 Initialization (lines 7 to 11)
4.2.4 Periodic updates task (lines 12 to 16)
4.2.5 Connection (lines 20 to 23)
4.2.6 Disconnection (lines 24 to 27)
4.2.7 Knowledge reception (lines 28 to 38)
4.2.8 Updates reception (lines 39 to 53)
4.2.9 Pending updates (lines 54 to 65)
4.2.10 Leader election (lines 17 to 19)
4.2.11 Execution examples
4.3 Simulation Environment
4.3.1 Algorithms
4.3.2 Algorithms Settings
4.3.3 Mobility Models
4.4 Evaluation
4.4.1 Metrics
4.4.2 Instability
4.4.3 Number of messages sent per second
4.4.4 Path to the leader
4.4.5 Fault injection
4.5 Conclusion
5 Centrality-Based Eventual Leader Election in Dynamic Networks
5.1 System Model and Assumptions
5.1.1 Node states and failures
5.1.2 Communication graph
5.1.3 Channels
5.1.4 Membership and nodes identity
5.2 Centrality-Based Eventual Leader Election Algorithm
5.2.1 Pseudo-code
5.2.2 Data structures, messages, and variables (lines 1 to 4)
5.2.3 Initialization (lines 5 to 7)
5.2.4 Node connection (lines 8 to 17)
5.2.5 Node disconnection (lines 18 to 23)
5.2.6 Knowledge update (lines 24 to 34)
5.2.7 Neighbors update (lines 35 to 41)
5.2.8 Information propagation (lines 42 to 47)
5.2.9 Leader election (lines 48 to 52)
5.3 Simulation Environment
5.3.1 Algorithms Settings
5.3.2 Mobility Models
5.4 Evaluation
5.4.1 Metrics
5.4.2 Average number of messages sent per second per node
5.4.3 Average of the median path to the leader
5.4.4 Instability
5.4.5 Focusing on the 60 meters range over time
5.4.6 A comparative analysis with Topology Aware
5.5 Conclusion
6 Conclusion and Future Work
6.1 Contributions
6.2 Future Directions
A Appendix
A.1 Energy consumption per node
A.1.1 Simulation environment
A.1.2 Algorithms settings
A.1.3 Mobility Models
A.1.4 Metric
A.1.5 Performance Results